Diagnostics Overview
Use this page to confirm if your PADS4 setup is operational at a glance. In a single-server configuration, the server status appears with a green dot next to the server name if it’s online.
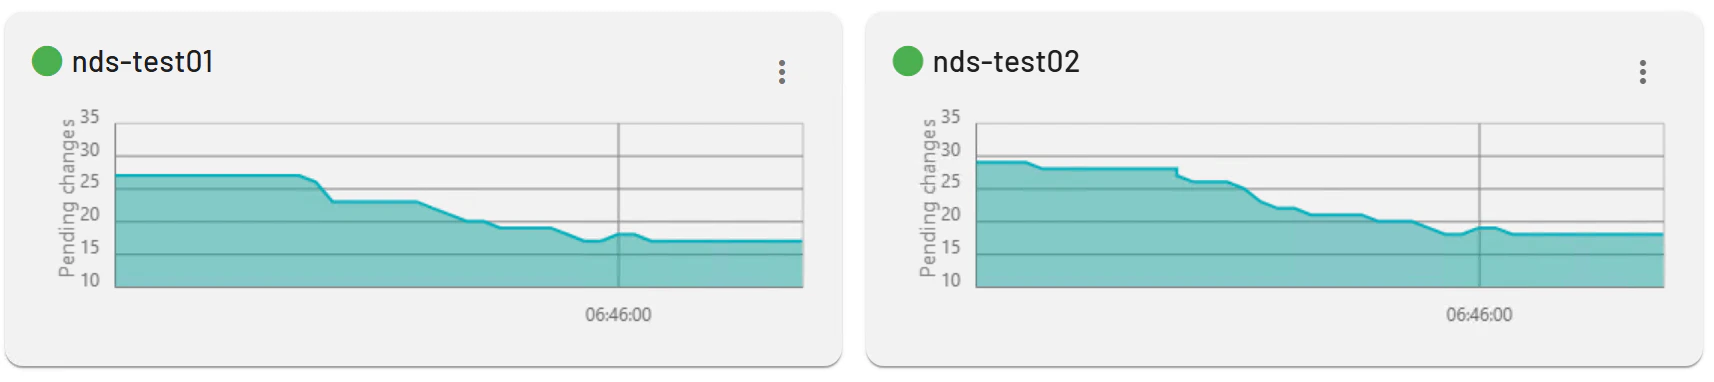
Multi-Server Setups
For distributed environments, multiple servers and their sync status display similarly, helping identify issues early. Green indicators confirm connectivity; other colors signal problems requiring attention. The multi-server setup page includes graphs that visualize synchronization metrics. These graphs display the number of pending changes queued for processing across servers.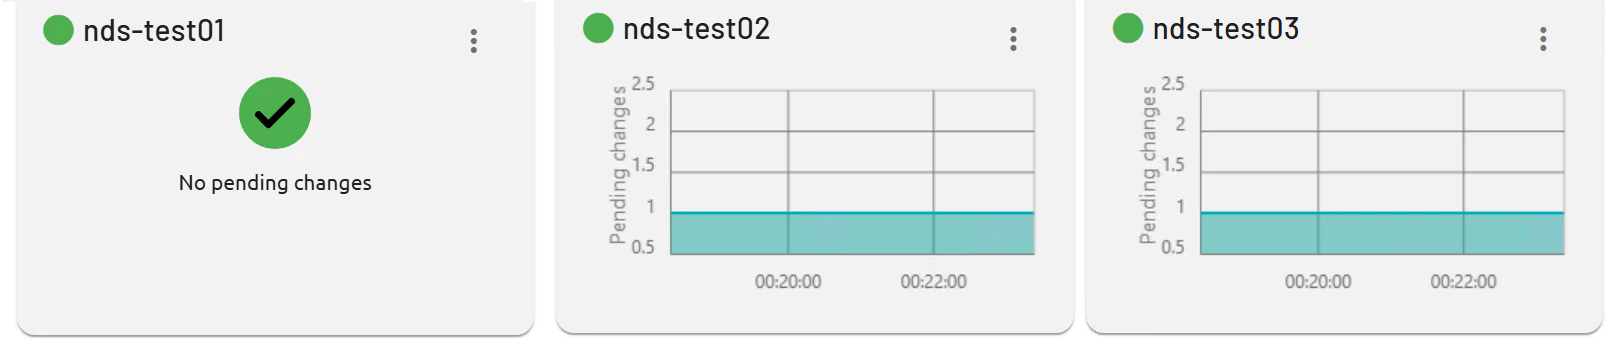
Services
On the left side of the page, all PADS4 services are listed with status indicators. A green check mark shows the service is healthy; a red exclamation mark signals an issue.