> ## Documentation Index
> Fetch the complete documentation index at: https://docs.pads4.com/llms.txt
> Use this file to discover all available pages before exploring further.
# Diagnostics
The Diagnostics section provides tools to monitor the health of your PADS4 system. The Overview page offers a quick visual summary of your PADS4 environment's status.
### **Diagnostics Overview**
Use this page to confirm if your PADS4 setup is operational at a glance. In a single-server configuration, the server status appears with a green dot next to the server name if it's online.
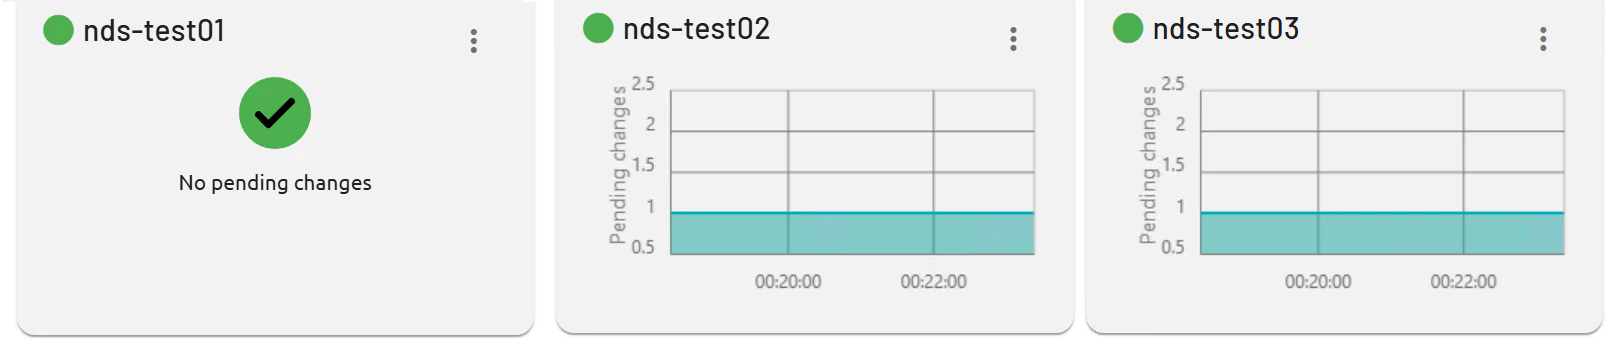
 ### **Multi-Server Setups**
For distributed environments, multiple servers and their sync status display similarly, helping identify issues early. Green indicators confirm connectivity; other colors signal problems requiring attention.
The multi-server setup page includes graphs that visualize synchronization metrics. These graphs display the number of pending changes queued for processing across servers.
### **Multi-Server Setups**
For distributed environments, multiple servers and their sync status display similarly, helping identify issues early. Green indicators confirm connectivity; other colors signal problems requiring attention.
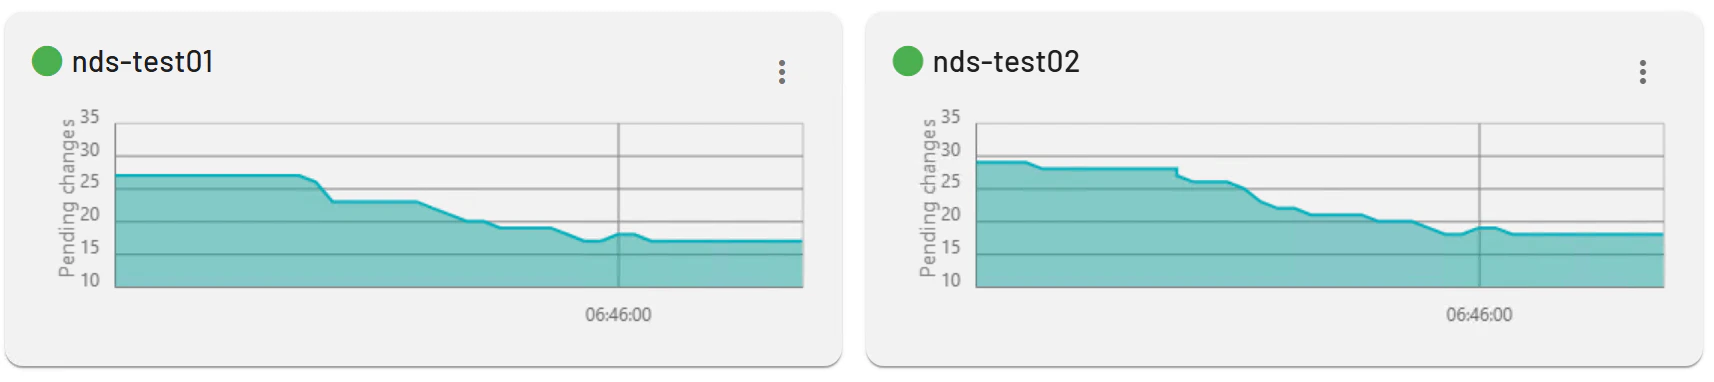
The multi-server setup page includes graphs that visualize synchronization metrics. These graphs display the number of pending changes queued for processing across servers.
 Graphs track the amount of changes (e.g., content updates or tasks) that must be synchronized and processed between the main server and sub-servers. High volumes may indicate delays; monitor to ensure timely distribution and system health.
 ## Services
On the left side of the page, all PADS4 services are listed with status indicators. A green check mark shows the service is healthy; a red exclamation mark signals an issue.
## Services
On the left side of the page, all PADS4 services are listed with status indicators. A green check mark shows the service is healthy; a red exclamation mark signals an issue.
 ### **Service Status**
Click any service to view its log file for detailed diagnostics. This helps troubleshoot errors like startup failures or connectivity problems in Foundation services or microservices. Logs reveal timestamps, errors, and events for quick resolution.
### **Service Status**
Click any service to view its log file for detailed diagnostics. This helps troubleshoot errors like startup failures or connectivity problems in Foundation services or microservices. Logs reveal timestamps, errors, and events for quick resolution.